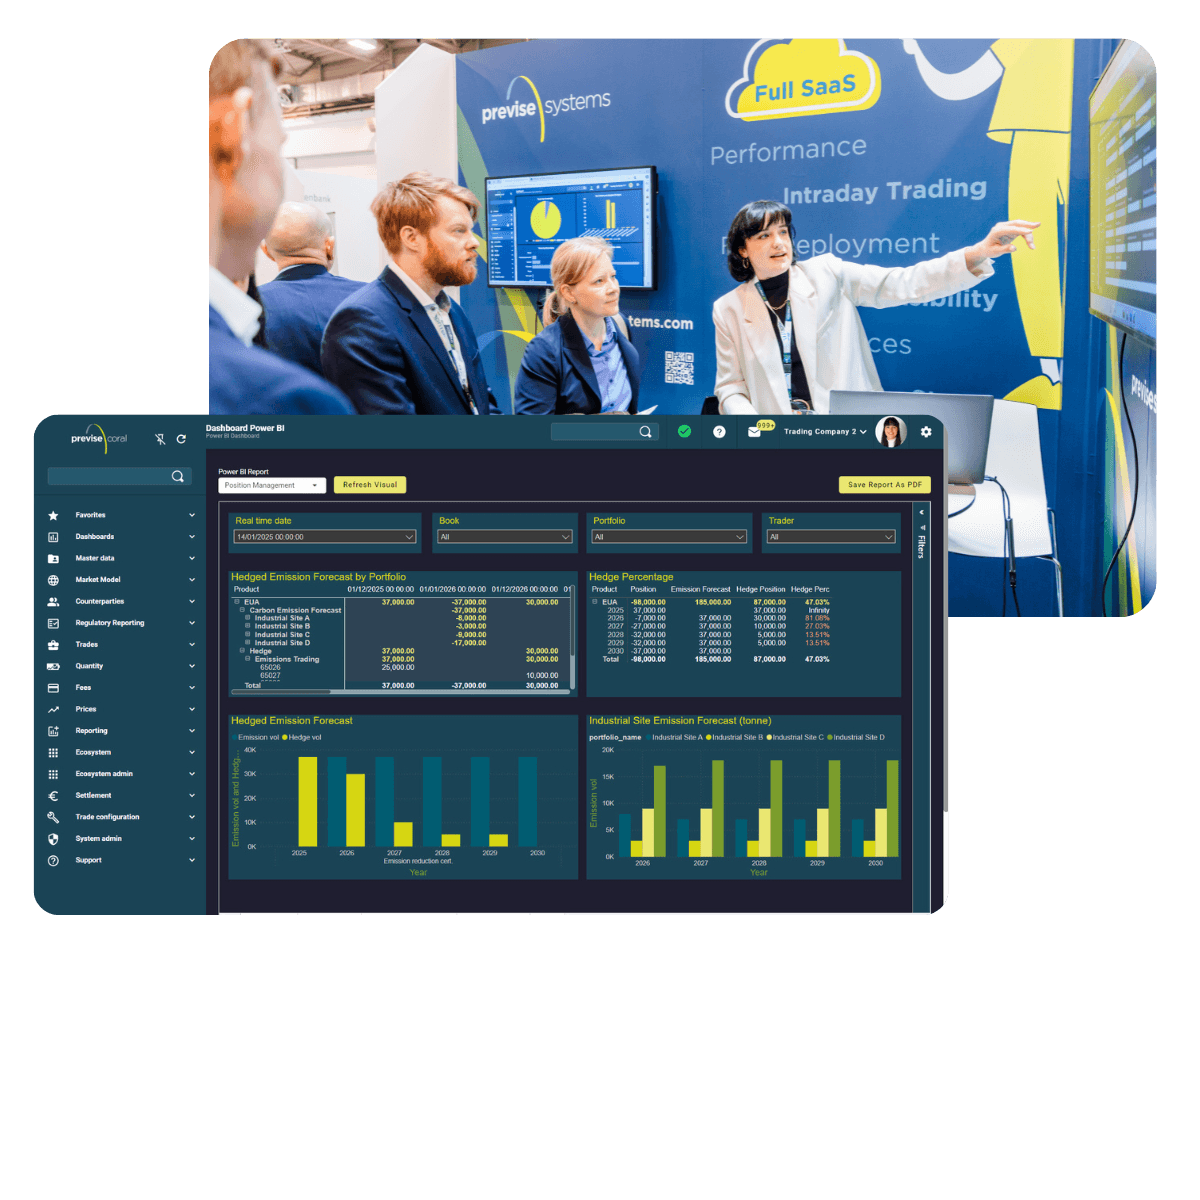
ETRM in the Cloud Era:Evolving from Legacy to Agility
Previse Coral is the central transactional engine for today's energy trading businesses: purpose built to master the full trade lifecycle - across power, gas, certificates, and complex contracts.
Designed around flexibility, openness, and performance, Coral empowers companies to streamline operations, unlock data across every stage of the trade lifecycle, and build a best-of-breed IT landscape that evolves with the market.
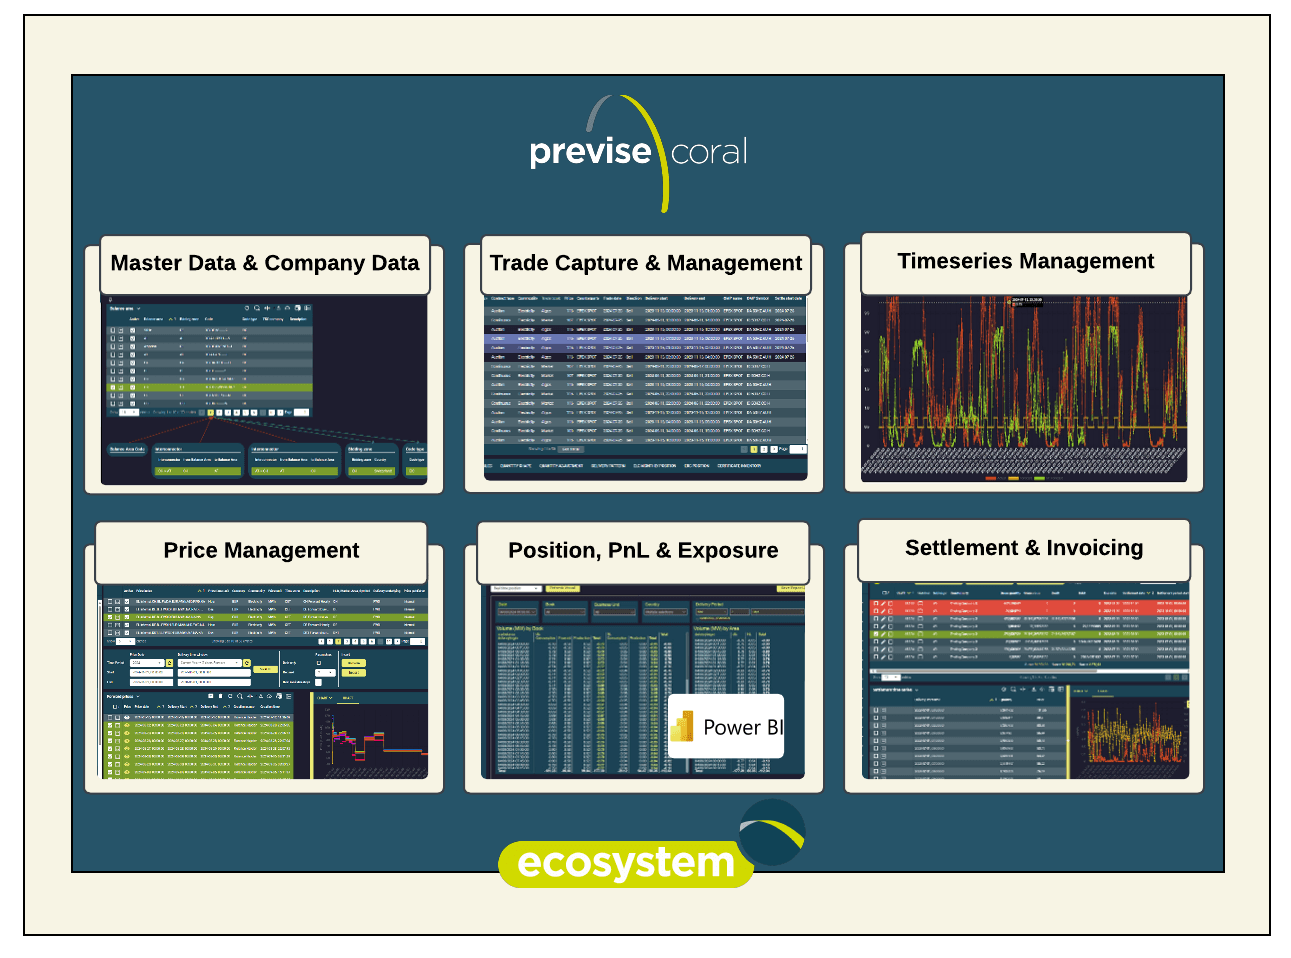
Previse Coral
Key strengths:

Previse Coral
Key strengths:
Core Features
Master Data & Company Data
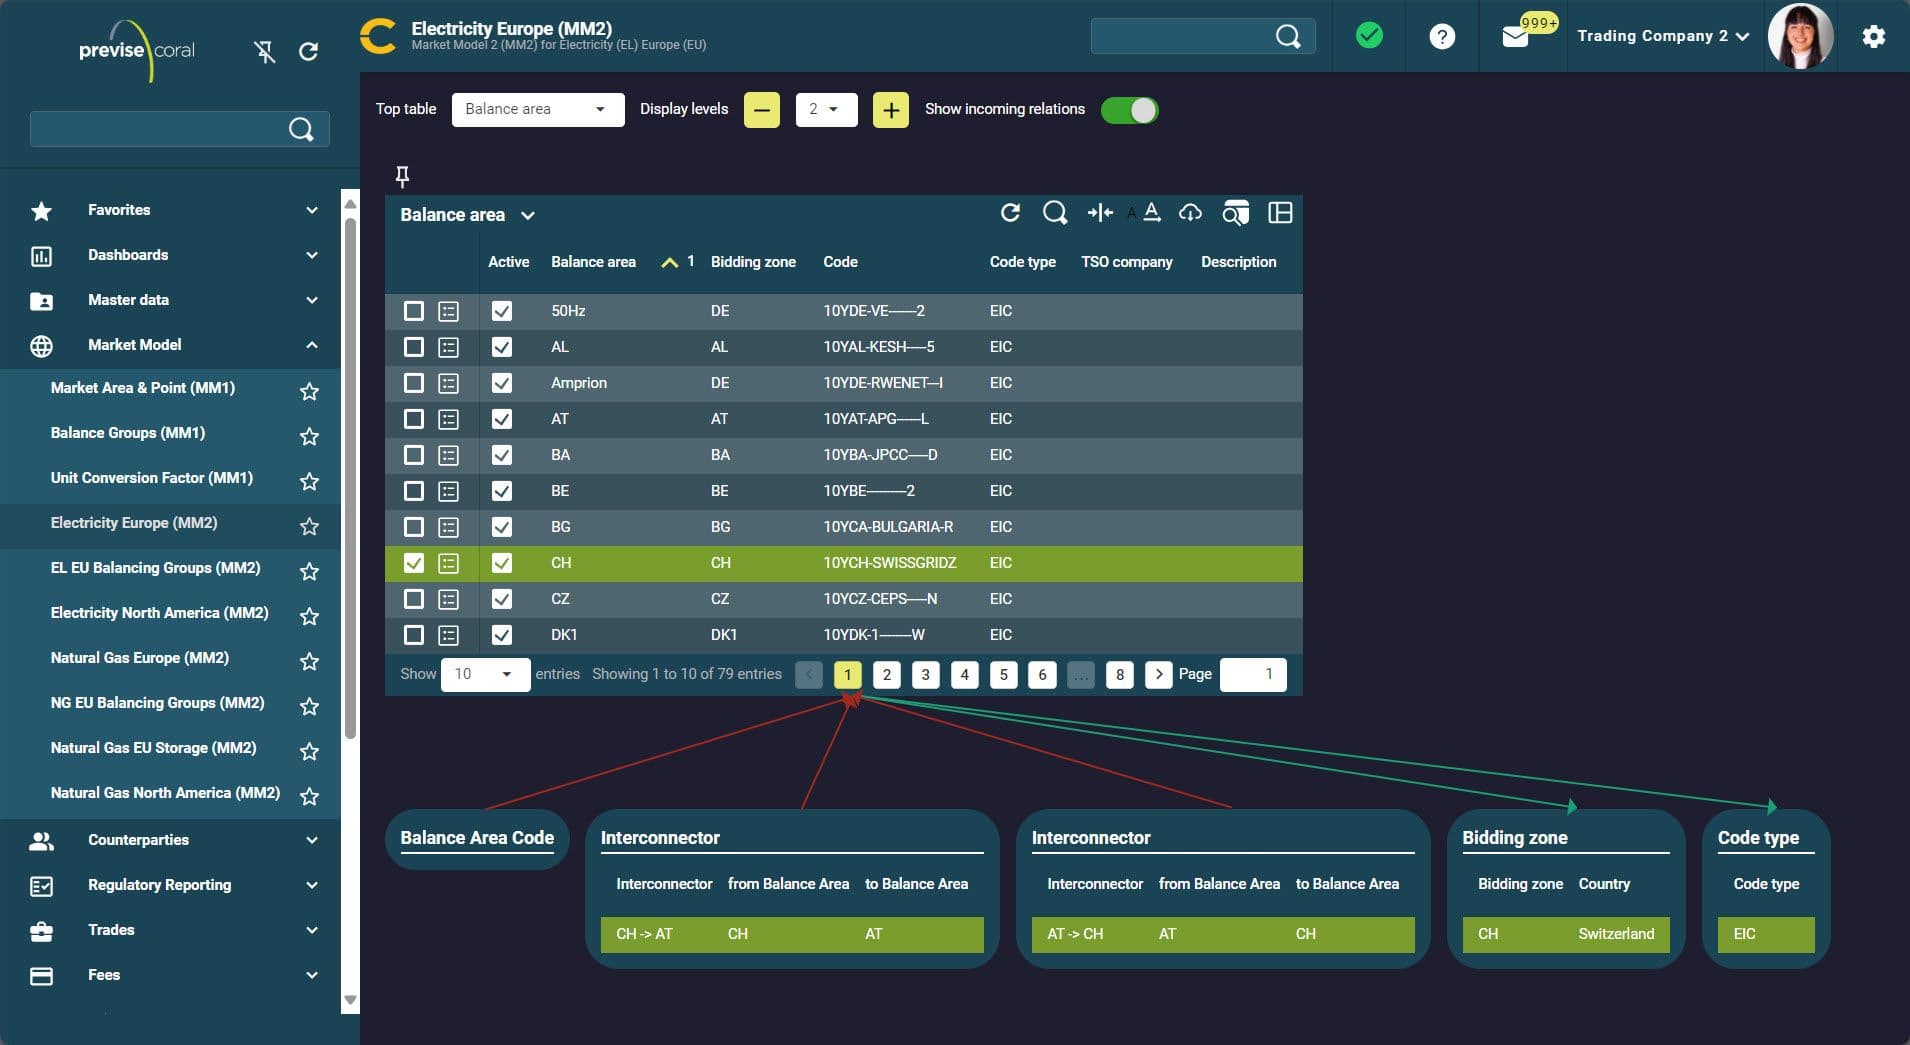
Previse Coral's unique Master Data as a Service (MDaaS) concept is our approach to centralise, validate and distribute market-standard reference data as a managed service. Previse's Master Data team manages and provides curated and continuously updated master data - such as company data and ID codes, exchange instrument definitions, trade entry templates, delivery calendars, cascading rules, and much more.
This service ensures consistency and accuracy across trading, risk, and settlement processes, drastically reducing implementation and maintenance effort, and minimising errors due to misconfigured or missing data. MDaaS enables customers to remain aligned with market standards while focusing their resources on higher-value trading and operational activities.
Core Features
Trade Capture & Management
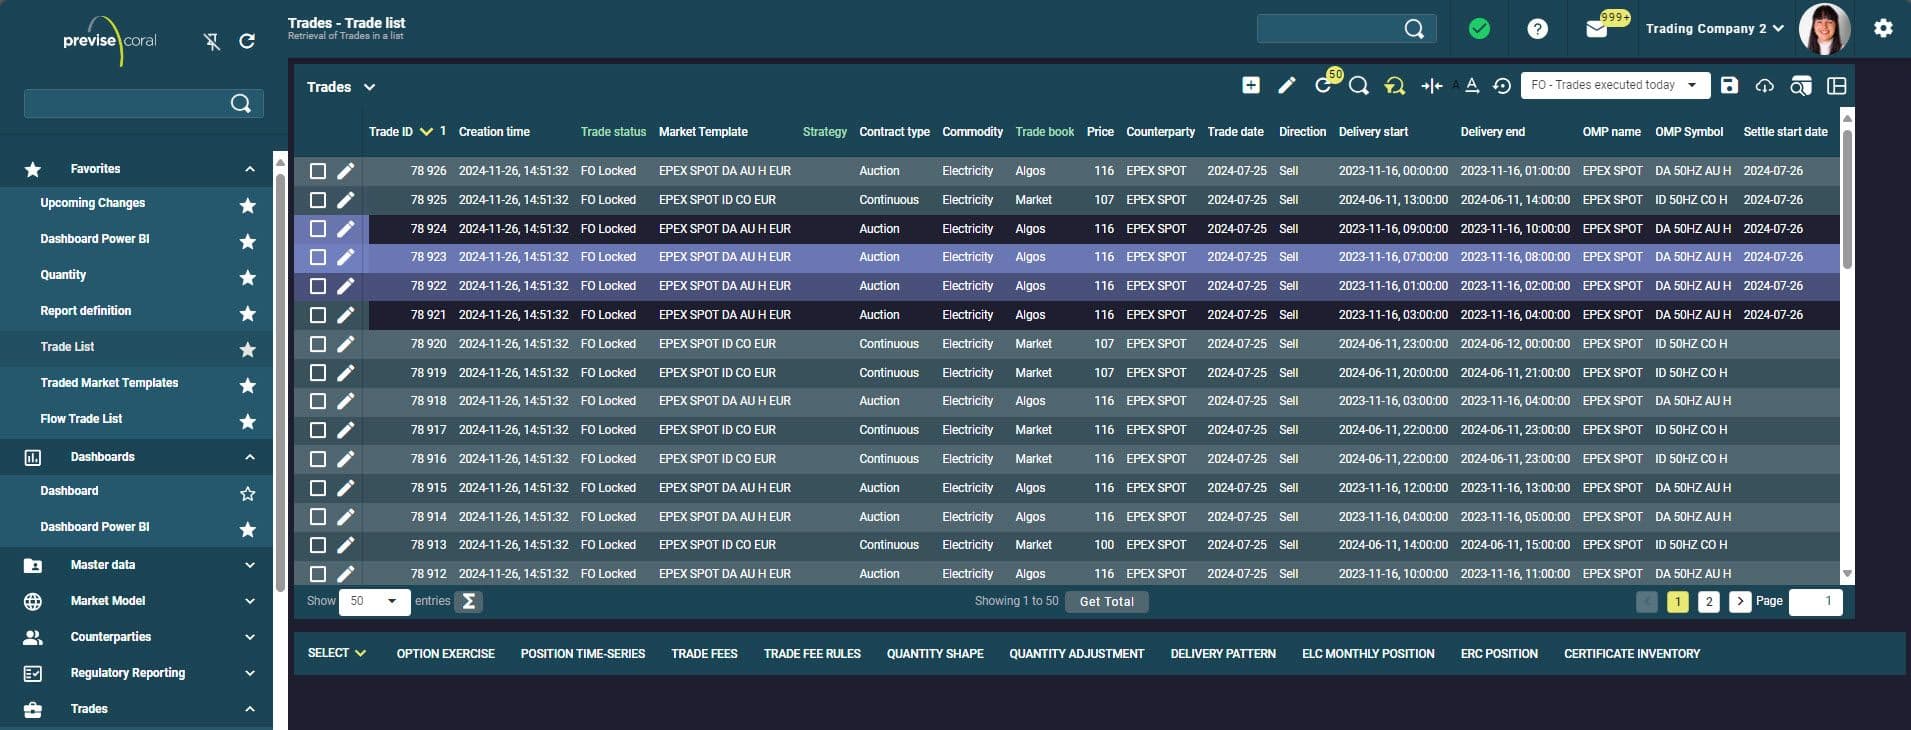
Previse Coral delivers a robust and flexible Trade Capture and Management capability designed to support the complex needs of modern energy trading firms.
It offers comprehensive multi-commodity support, enabling the seamless handling of power, gas, emissions, and certificates such as Guarantees of Origin (GoOs). Coral accommodates a wide range of instruments, including spot, forwards, futures, swaps and options, across both exchange and OTC markets. Integration with leading trading platforms such as Trayport and algotrading systems like PowerBot is enabled via Coral’s Ecosystem, ensuring swift and reliable ingestion of trades from external platforms.
Coral is exceptionally capable in supporting short-term trading activities, offering the speed and responsiveness required for high-frequency intraday and day-ahead markets. Its architecture is optimized to handle thousands of trades per day with minimal latency, enabling real-time position updates that are critical in fast-moving environments.

Core Features
Time Series Management
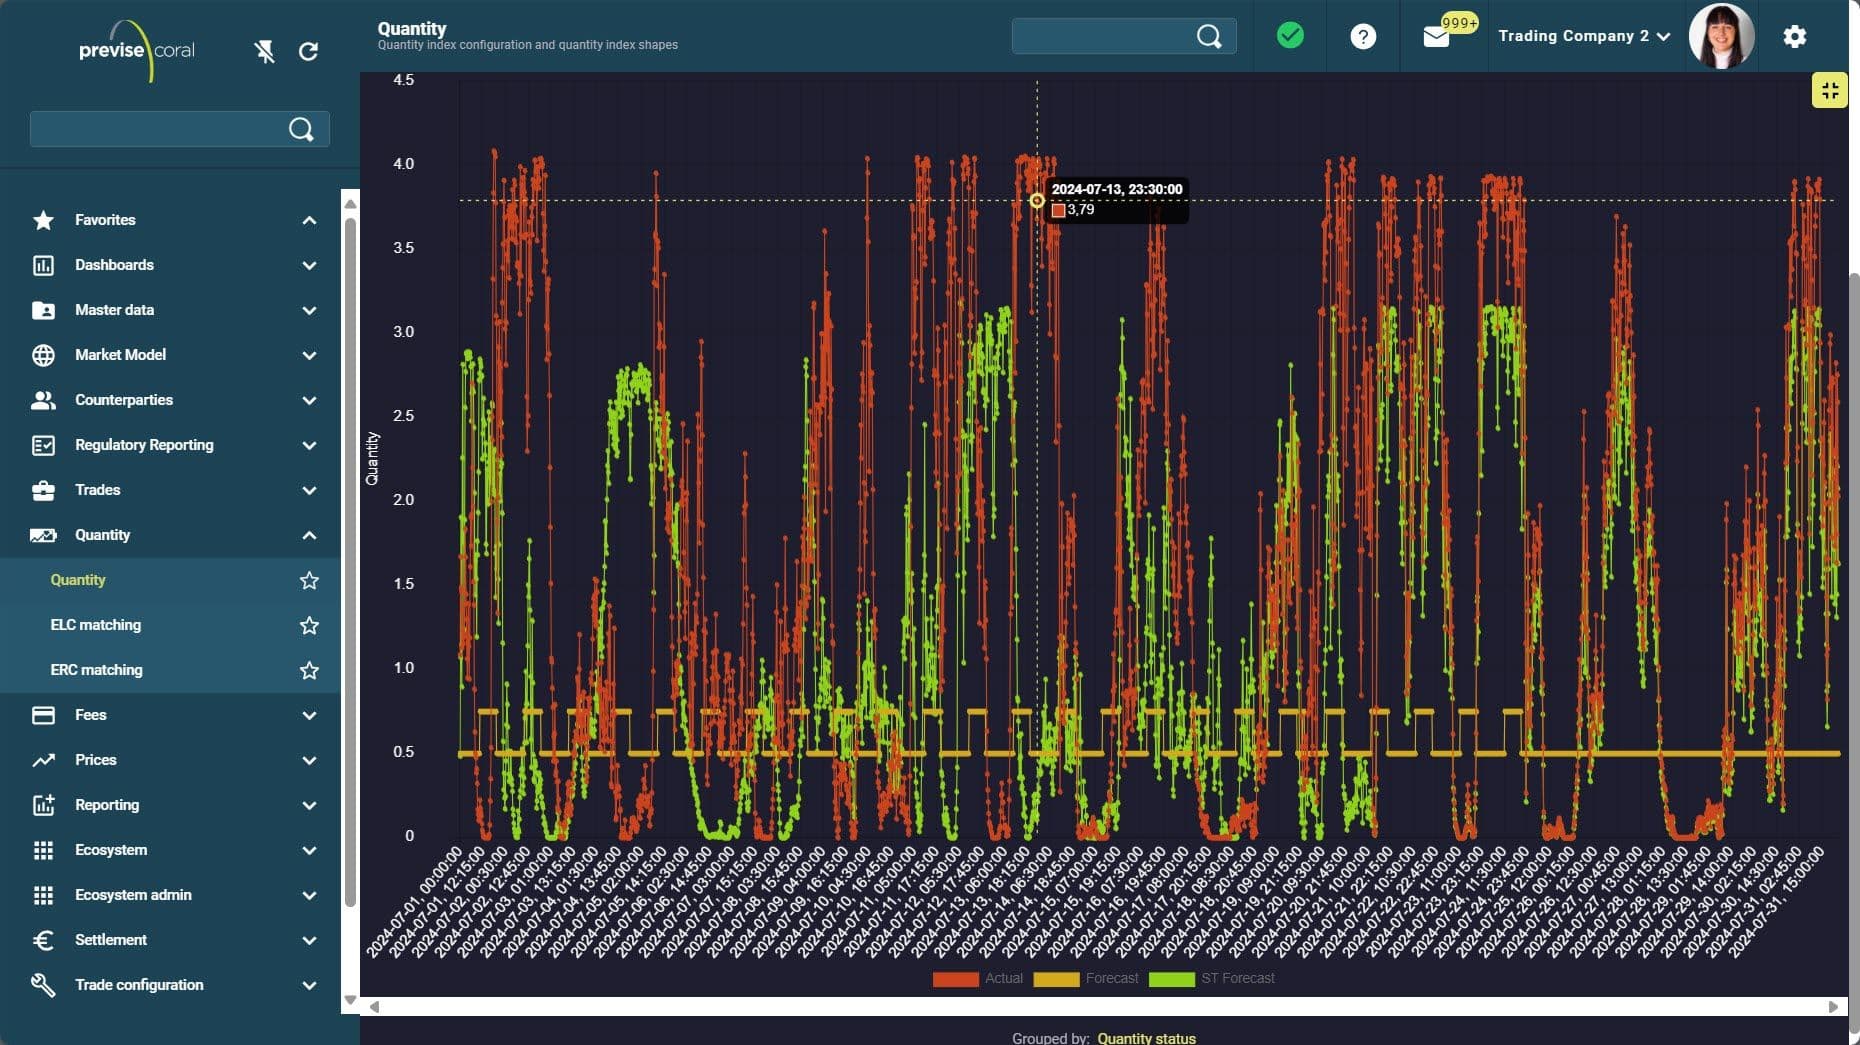
Previse Coral features a dedicated time series management component built to handle the high-volume operational data typical in energy trading environments. It supports storage, calculation, and reporting at one-minute granularity, with features such as configurable "Quantity Statuses" (e.g. Forecast, Actual, Nominated), a native formula builder, and powerful comparison and reporting via the integrated Reporting engine.
Core Features
Price Management
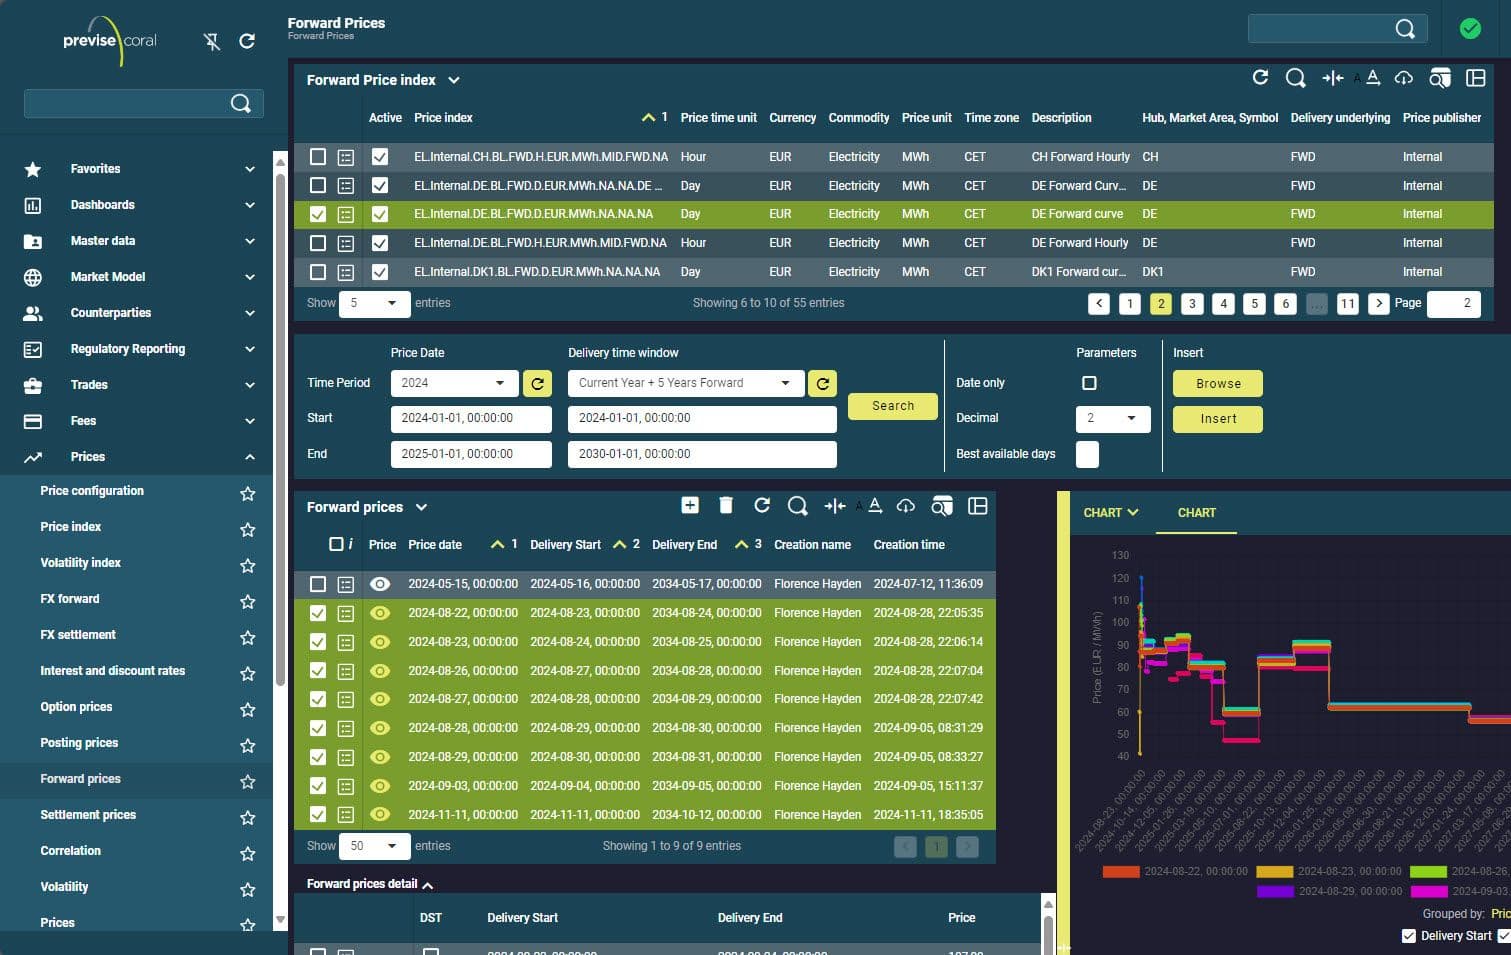
Previse Coral's REST Price API simplifies importing prices from any source by providing an open, JSON-based interface that ensures ease of integration with external sources.
Price management functionality supports complex pricing structures with configurable formulas, multi-index handling, cross-commodity logic, FX conversions, and averaging rules.

Core Features
Position, PnL & Exposure
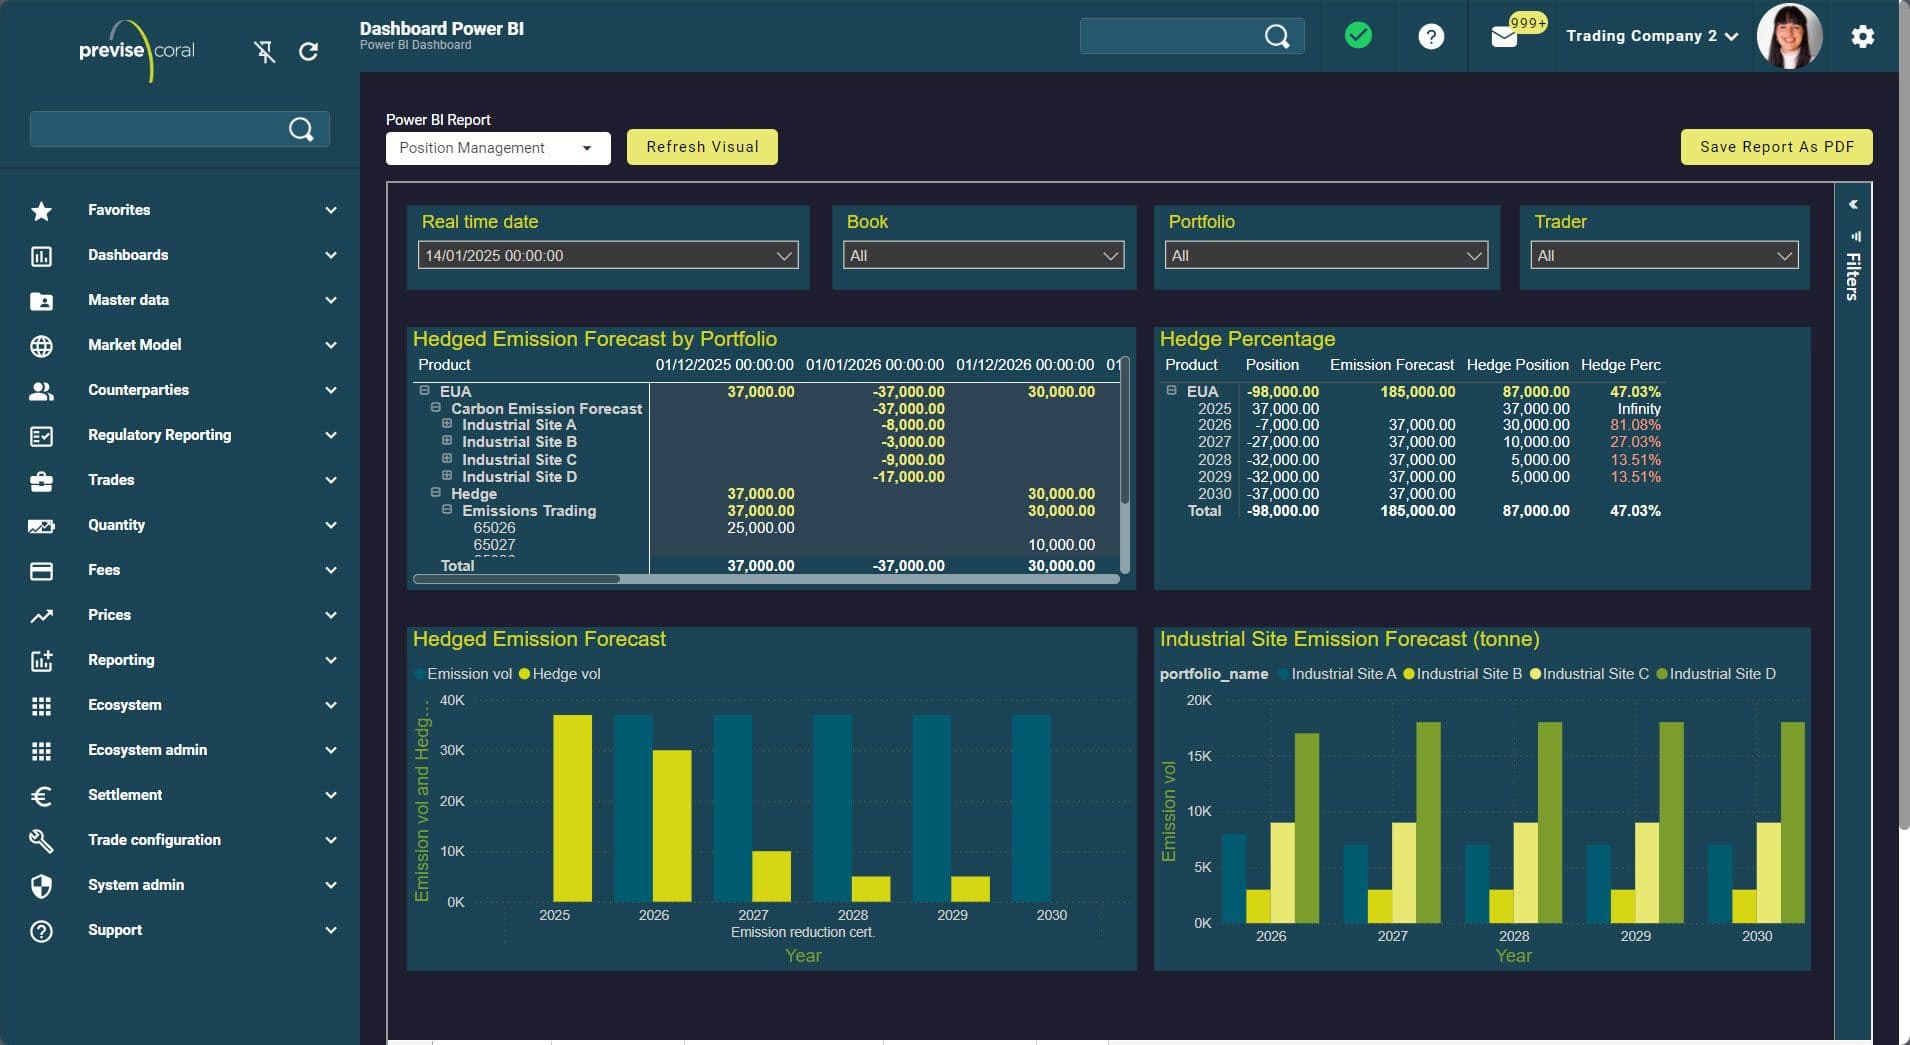
Previse Coral provides MtM, PnL, exposure, and real-time position data by configurable dimensions and delivery granularity through an advanced reporting engine, visualised via embedded Power BI. These core metrics serve as the foundation for advanced risk analysis, with out-of-the-box support for PnL attribution and limit monitoring.
Core Features
Settlement & Invoicing
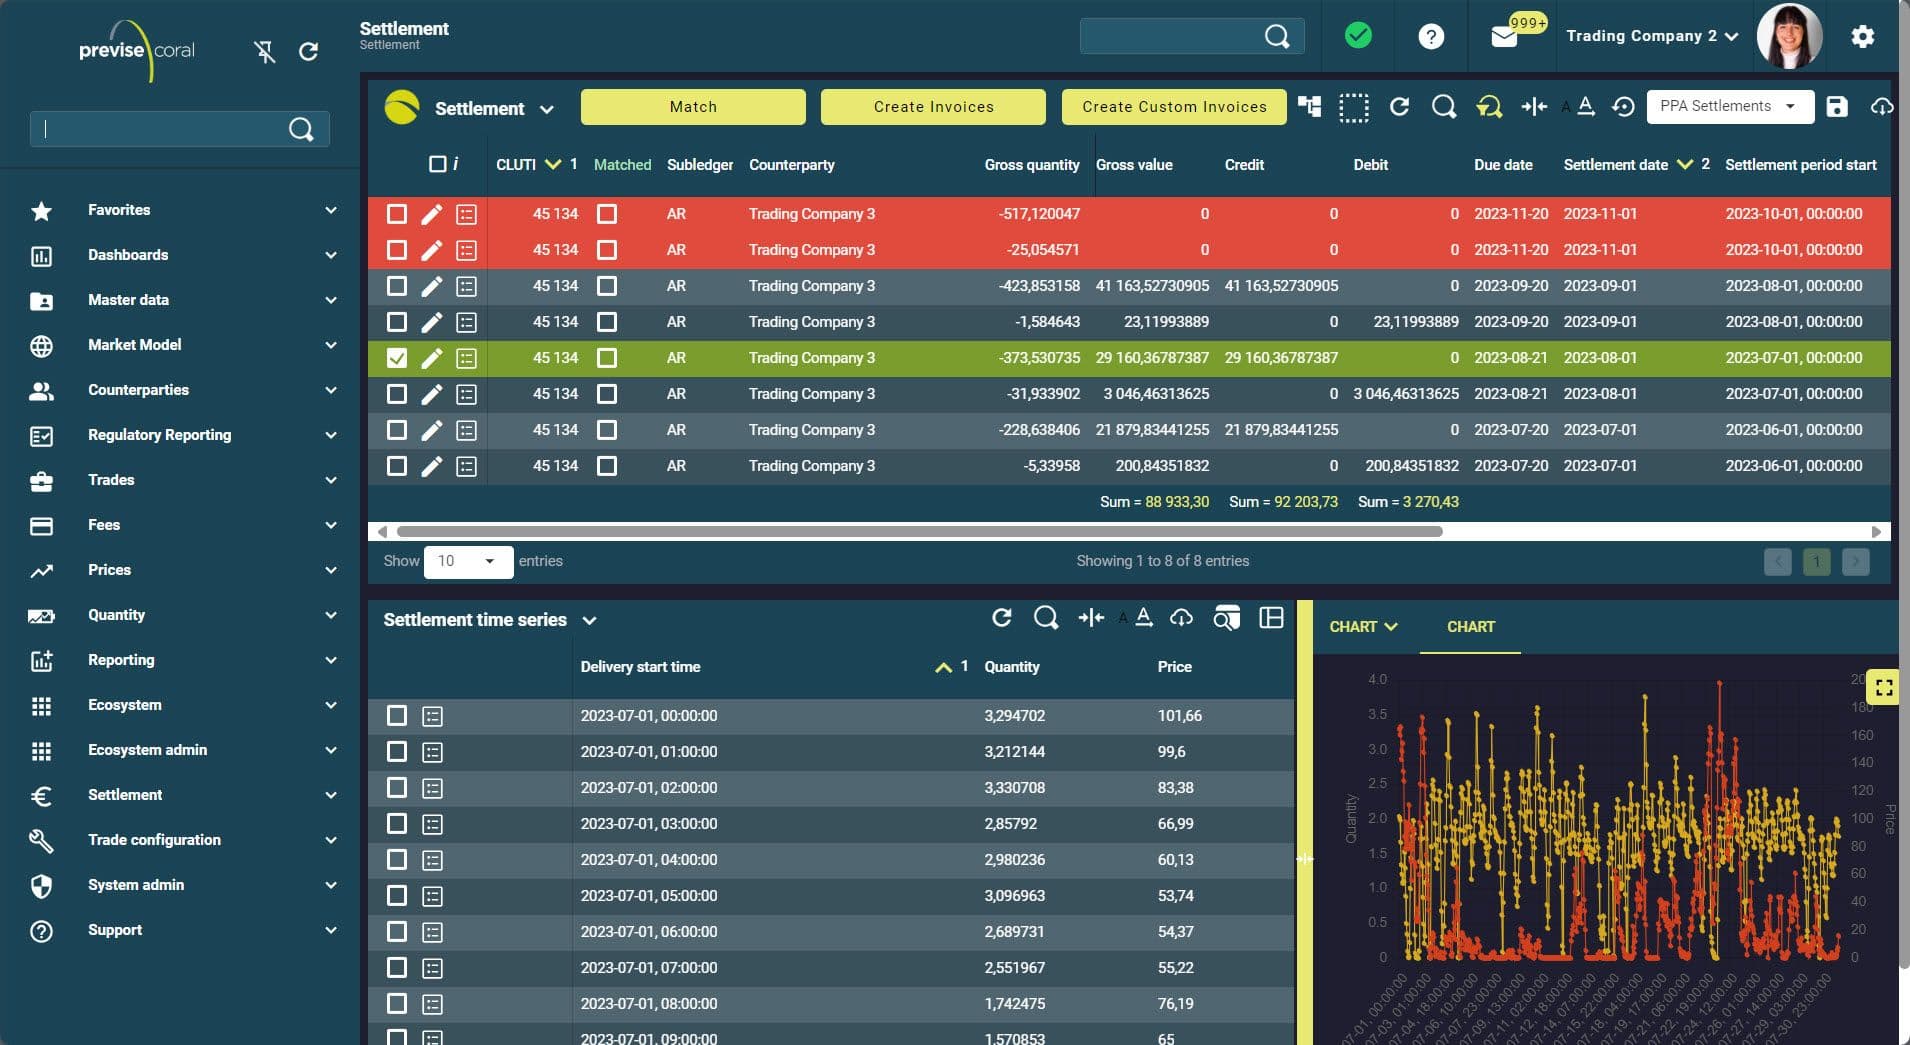
Previse Coral’s settlement and invoicing functionality calculates settlement values and due dates based on both simple and complex payment terms, including exchange-standard rules. It generates structured settlement records to support reliable reconciliation against third-party invoices and smooth integration with ERP systems.

Where Energy Trading Finds Its Flow
The Previse Coral Ecosystem gives developers the freedom to shape the Coral platform to their unique needs - or to build and publish apps for others via the Previse App Store. Powered by a comprehensive Software Development Kit (SDK), it includes all the tools, libraries, and frameworks needed to develop custom apps, create new user interfaces, and add bespoke automations and features.
